Summary:
In this article, we will learn what, why and how to do Feature Scaling – Normalization & Standardization.
We will also learn about about the common mistakes a beginner may do on Feature Scaling, so that we can avoid those mistakes to mitigate the bias happening in the model due to feature scaling mistakes.
And then we see the comparison of Normalization & Standardization to handle outliers in a better way and so to avoid loss of data. And most importantly, we will see the visualizations of Normalization & Standardization for better understanding.
5 Part series of most important Data Pre-Processing Techniques of Machine Learning:
- Part 5 – Dimensionality Reduction – Will be published
Feature Scaling is a part of Feature Engineering.
Table of Contents:
- Data Source used in this article
- What is feature Scaling?
- Why we need Feature Scaling?
- Types of Feature Scaling
- What is Normalization?
- What is Standardization or Z-Score Normalization?
- Normalization Vs Standardization
- Common Mistakes on Normalization/Standardization
Data Source used in this article:
To learn feature scaling, we will use the Pima Indians Diabetes data from Kaggle, from which we have to predict the income of the people.
data = pd.read_csv('diabetes.csv')
data.head()

Before start working on Normalizing data, we need to do other data preprocessing steps such as imputations, data type verifications etc.
To verify data types, please check the Part I of this series 5 Most important Data Pre-Processing Techniques for Machine Learning.
To apply imputation please check the Part II of this series 5 Most important Data Pre-Processing Techniques – Impute missing data.
This data does not contain much NaN values. But it has zeros in some columns which should not be. Example, Glucose has 0 value which is impossible. So we need to impute based on analyzing data.

data['Glucose'] = data['Glucose'].replace(0,round(data['Glucose'].mean()))
This is a sample imputation, we may need to do more analysis and pre-processing for better accuracy.
What is feature Scaling?
Feature scaling is a process of bringing all the independent features into the same value range. Either -1 to 1 or 0 to 1.
For example, let’s say we have two features x1 & x2.
x1 ranges from 1 to 100.
x2 ranges from 10,000 to 100,000
Feature Scaling will change all the feature’s values into same level. Either -1 to 1 or 0 to 1.
In data processing, it is also known as data normalization.
Why we need Feature Scaling?
Now the most important question is why we need normalization?
Lets take the same X1 (1 – 100) & X2 (10,000 to 100,000).
When features are in different scaling or when using algorithms that highly depends on the distances for example KNN – K-Nearest Neighbour, the result may have high deviation due to the different range of values. In these cases, Normalization is required.
Apart from this, there are some more major impacts due to the different range of independent features.
Impact #1: Slow to converge to the optimum value or Never converge
At the time of optimization (Gradient Descent), the weights will be updated in order to converge to the optimum value.
While updating weights, in order to maintain the magnitude, the weights W1 applied to X1 should be more higher than the weights W2 which are applied to X2. That may seem like some features are more important and some features are less important while we need to consider all the features with same importance.
Impact #2: Computation complexity while dealing with large numbers
When the numbers are large, the computation also becomes complex.
After normalization, the features will be either between 0 to 1 or in -1 to 1. This leads to the faster computation and fast convergence.
Types of Feature Scaling:
- Normalization or Min-Max Scaling: Ranges from 0 to 1
- Standardization or Z-Score Normalization: Ranges from -1 to 1 and mean of new data become 0 and standard deviation as 1.
- Constant factor normalization
We will learn about Normalization & Standardization in this article.
1. What is Normalization?
Normalization is a process of shifting/rescaling the data into a range. For example either between 0 and 1 or between -1 & 1.
The minimum value will be mapped with 0 & the maximum value will be mapped with 1. Based on this the other values will be scaled.
Lets understand with an example: If the data is [100, 200, 300] then,
Minimum value = 100 rescaled to 0
Maximum value = 300 rescaled to 1
Other datapoint = 200, which is in the center of 100 & 300. So its converted to 0.5
Converting data into range in-between 0 and 1 is called Min-Max Scaling
To do the Min-Max Scaling, the below calculation will be used
X’ = (X – min) / (max – min)
min – Minimum value of the feature
max – Maximum value of the feature.
Say X is a raw feature and X’ is a rescaled feature.

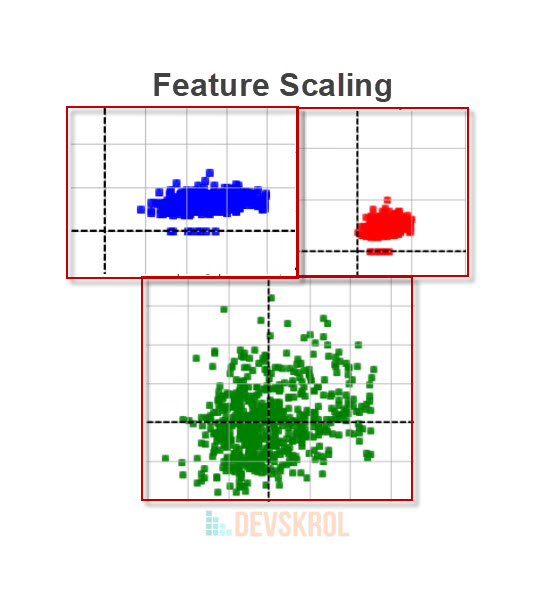
In the above visualization, notice that the Raw data is scattered between 0 – 70 in Y axis and 40 to 200 in X axis.
After normalization, the Data is scattered between 0 to 1.
Lets understand the calculation using the below simple math example:
X = {20, 30, 10, 40, 50}
min = 10
max = 50
max – min = 50 – 10 = 40
| X | X – min | X’ = (X – min) / (max – min) |
| 20 | 10 | 0.25 |
| 30 | 20 | 0.5 |
| 10 | 0 | 0 |
| 40 | 30 | 0.75 |
| 50 | 40 | 1 |
How to do Normalization in Machine Learning?
For machine learning algorithms, Normalization should be applied on all data before fitting the algorithm.
Steps of Normalization:
- Create a normalization object.
- Use that object and scale (fit) using training data
- Transform the Train data using the same object.
- Transform the Test data using the same object.
- While predicting target variable for a unknown data, transform that single data using same object and then do prediction.
Now you may have a question, why we should normalize test and unknown data while prediction?
Let’s say a calculation is applied on a liquid data. The measures provided in the data is in Liters. But your system only accepts in milliliters and the inner calculation is done considering that the liquid is in milliliters. So, we should convert the new input to milliliters and then send the input to the system.
In the same way, If the normalization is done on training data, then the same scaling should be applied for testing, validation & prediction.
The scaling will be created based on the values of training data as a model will be trained on the train data. The same exact scaling object created by the train data will be saved to a variable and then used for test data and unknown data.
Before apply normalization, let’s split the data into train and test. We also should remove the target variable from the train data to avoid data leakage.
from sklearn.model_selection import train_test_split

X = data.drop(['Outcome'],axis=1)
y = data['Outcome']

X_train, X_test, y_train, y_test = train_test_split(X, y, test_size=0.2, random_state=101)

X_train.shape, X_test.shape
((614, 8), (154, 8))
In the above code, we have split the data into train and test. Now we ate good to apply Normalization.
Min-Max normalization Example with sklearn.preprocessing.MinMaxScaler:
To do Min-Max normalization Scikit-learn provides a module sklearn.preprocessing.MinMaxScaler.
Let’s apply the Min-Max Normalization in Pima Indians Diabetes data:
from sklearn.preprocessing import MinMaxScaler

#Step 1: Create MinMaxScaler object
minmax_scalar = MinMaxScaler()

#Step 2: Use that object and scale (fit) using training data
minmax_scalar.fit(X_train)

#Step 3: Transform the Train data using the same object.
X_train_minmax_scaled = minmax_scalar.transform(X_train)

#Step 4: Transform the Test data using the same object.
X_test_minmax_scaled = minmax_scalar.transform(X_test)
Analyze the train data: Transformation is made based on the min & max values of the train data. Each column’s min and max values will be taken and mapped with 0 & 1 respectively. And then based on that range, the remaining data points will be transformed.
print("Min : ", X_train_minmax_scaled.min())
print("Max : ", X_train_minmax_scaled.max())
print("Mean: ", X_train_minmax_scaled.mean())
Min :  0.0
Max :  1.0
Mean:  0.39592409881228685
Analyze the test data: The test data is scaled based on the train data. The rescaling of test data will still use the train data’s min & max values as we are using the same object and just transform() function is applied. The test data’s min & max values will not be used for transformation.
So, test data’s min and max values does not need to be in range of 0 to 1. In other words, test data is a subset of train data as test data follows the train data’s transformation object.
print("Min : ", X_test_minmax_scaled.min())
print("Max : ", X_test_minmax_scaled.max())
print("Mean: ", X_test_minmax_scaled.mean())
Min :  0.0
Max :  0.9870967741935484
Mean:  0.39198816823450255
Variations of Min-Max normalization – Different range:
The normalization can be done with different range for example -1 to 1.
The MinMaxScaler() takes an argument feature_range to specify the range for transformation. When not specified, the default range will be 0 to 1.
from sklearn.preprocessing import MinMaxScaler

#Step 1: Create MinMaxScaler object
minmax_scalar_n = MinMaxScaler(feature_range=(-1, 1))

#Step 2: Use that object and scale (fit) using training data
minmax_scalar_n.fit(X_train)

#Step 3: Transform the Train data using the same object.
X_train_minmax_scaled_n = minmax_scalar_n.transform(X_train)

#Step 4: Transform the Test data using the same object.
X_test_minmax_scaled_n = minmax_scalar_n.transform(X_test)

print("Train\n=====")
print("Min : ", X_train_minmax_scaled_n.min())
print("Max : ", X_train_minmax_scaled_n.max())
print("Mean: ", X_train_minmax_scaled_n.mean())

print("\nTest\n====")
print("Min : ", X_test_minmax_scaled_n.min())
print("Max : ", X_test_minmax_scaled_n.max())
print("Mean: ", X_test_minmax_scaled_n.mean())
Train
=====
Min :  -1.0
Max :  1.0
Mean:  -0.20815180237542635

Test
====
Min :  -1.0
Max :  0.9741935483870967
Mean:  -0.21602366353099492
2. What is Standardization or Z-Score Normalization?
Standardization or Z-Score Normalization is the process of transforming data such that the mean is 0 and standard deviation of 1.

To do standardization, the below calculation will be used.
x’ = (x – u) / sd
u is the mean of data
sd is the standard deviation of data.
Say X is a raw feature and X’ is a rescaled feature.
How to do Standardization in Machine Learning?
Standardization follows the same steps as of Normalization. Except that we will use StandardScaler instead of Min-Max Scaler.
Steps of Standardization:
- Create a Standardization object.
- Use that object and scale (fit) using training data
- Transform the Train data using the same object.
- Transform the Test data using the same object.
- While predicting target variable for a unknown data, transform that single data using same object and then do prediction.
Standardization or Z-Score Normalization Example with sklearn.preprocessing.StandardScaler:
As we have seen many rules and conventions about train & test data, let’s directly do the Standardization.
from sklearn.preprocessing import StandardScaler

std_scalar = StandardScaler()
X_train_std_scaled = std_scalar.fit_transform(X_train)
X_test_std_scaled = std_scalar.transform(X_test)

print("Train\n=====")
print("Min : ", X_train_std_scaled.min())
print("Max : ", X_train_std_scaled.max())
print("Mean: ", X_train_std_scaled.mean())
print("Standard Deviation: ", X_train_std_scaled.std())
print("\nTest\n====")
print("Min : ", X_test_std_scaled.min())
print("Max : ", X_test_std_scaled.max())
print("Mean: ", X_test_std_scaled.mean())
print("Standard Deviation: ", X_test_std_scaled.std())
Train
=====
Min :  -4.08932186174685
Max :  4.899126691695547
Mean:  2.410907762486768e-17
Standard Deviation:  1.0

Test
====
Min :  -4.08932186174685
Max :  3.457120378387054
Mean:  -0.037525546448659214
Standard Deviation:  1.004793118485146
Normalization Vs Standardization:
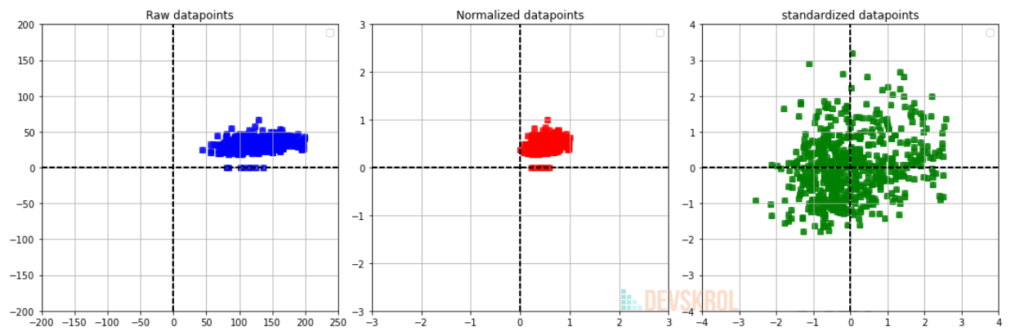
- Normalization is a process of transforming the data into a range mostly 0 to 1 whereas standardization transforms data to have a mean of zero and a standard deviation of 1.
- Normalization is a technique that keeps the relationship among original data as it is a linear transformation whereas Standardization changes the datapoint’s position by changing the mean to 0 & standard deviation as 1.
- Thus Normalization still retains the Outliers and it will not impact the models which cares about the outliers (Where the model needs to learn on data which looks like outliers but it is also a original value) whereas Standardization do not.
- For #2 & #3, Ref. from: arXiv:1503.06462
Common Mistakes on Normalization/Standardization:
Mistake #1:
A common mistake that is done with feature scaling is creating and applying separate scaling on training and testing. i.e. using fit_transform for both train & test data.
If you apply fit_transform() on both train & test data, what you are doing is you are, finding a min and max within train data and apply transformation in train data. And, you are finding a new min & max within test data and apply transformation in test data.
The reason why we should not do this is, while splitting the train & test data, we are assuming the test data as unseen data. So, this gives a good estimation of the model’s performance. Thus we consider each data point in the test data as a new unseen data
Ref: https://sebastianraschka.com/faq/docs/scale-training-test.html
i.e., We assume that we do not know the other data points when we are handling the first test data point. So, we cannot combine all the test data points and find new parameters such as mean, minimum, maximum & Standard Deviation.
Even if the new parameters are found and applied transformation based on that in test data, then that means we are not applying the trained model in a same scaled data. We trained the data of scale in liters and testing the model with the data of milli liters. The estimations we do on this type of test data does not give the true & exact results of the model.
The fit_transform() should be used on train data. And only the transform() alone should be applied on test data.
std_scalar = StandardScaler()
X_train_std = std_scalar.fit_transform(X_train)
X_test_std = std_scalar.transform(X_test)
Mistake #2:
Another common mistake in Feature Scaling in applying the scaling before splitting the train and test data. This implicitly means that we already know the test data and we are creating a model based on that test to get good result. This is called data leakage. In other words the model is biased.
In real life example, the quiz master already know what the participants know and creating Quiz only on those topics as a favor for the participants. That is the quiz master is biased.
It is also mentioned in the doc text of minmax_scale() function.
Source code of sklearn.preprocessing.MinMaxScaler
.. warning:: Risk of data leak
Source
Do not use :func:~sklearn.preprocessing.minmax_scaleunless you know
what you are doing. A common mistake is to apply it to the entire data
before splitting into training and test sets. This will bias the
model evaluation because information would have leaked from the test
set to the training set.
In general, we recommend using
:class:~sklearn.preprocessing.MinMaxScalerwithin a
:ref:Pipeline <pipeline>in order to prevent most risks of data
leaking:pipe = make_pipeline(MinMaxScaler(), LogisticRegression()).
Conclusion:
In this article we learned Feature Scaling techniques and its details.
This is part IV of 5 part series.