Choropleth Map is a thematic Map in which areas of the map are colored or patterned using a statistical variable.
Lets take the COVID-19 data of 2020.
Data Source:
- https://www.tableau.com/covid-19-coronavirus-data-resources
- https:/query.data.world/s/ydb5tncrsnsuh3tyzx5466o5hiacem
Using Plotly Express:
Plotly Express is an easy-to-use interface for Plotly.
plotly.express is a module contains functions and these functions are built-in part of the plotly library.
Each function returns a plotly.graph_objects.Figure instance.
This module also provides easy to use maps. Some are,
- Tile Maps
- Choropleth Maps
- Outline Maps
In this article, we will learn about Choropleth Maps.
To make a Choropleth Map, we need two main types of inputs.
- GeoJSON-formatted geometry information
- Statistical Variable
GeoJSON-formatted geometry information can be obtained either using FIPS IDs or using country/state codes.
From URL https://raw.githubusercontent.com/plotly/datasets/master/geojson-counties-fips.json. This JSON provides the FIPS (Federal Information Processing Standard Publication) IDs. If our data contains this IDs in a variable then these GeoJSON will map that variable with these IDs for country codes.
Statistical Variable is the main input for which the area are marked/colored/patterned.
Choropleth Map using FIPS IDs:
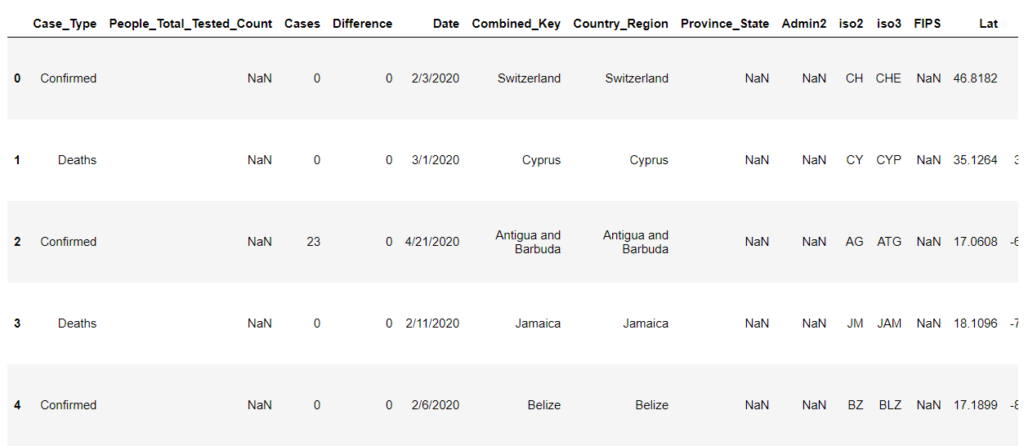
import pandas as pd
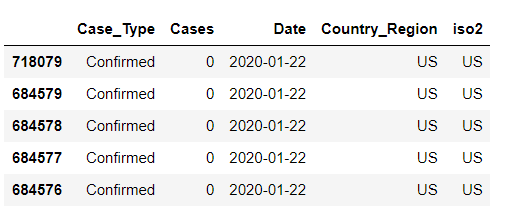
covid = pd.read_csv("COVID-19 Cases.csv")
covid.head()
We will collect all the data for one date “2020-05-02” and mark it in the Map.
The DATE column is not in datetime datatype.
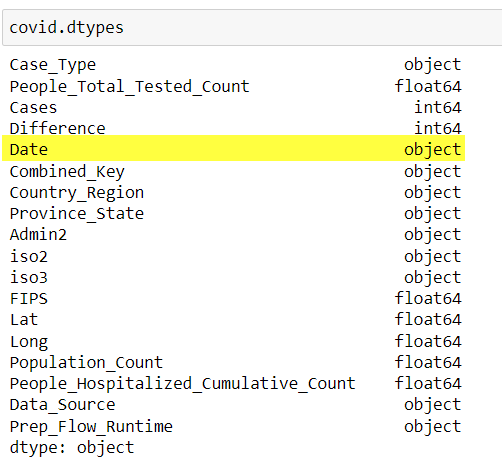
Convert it to datetime64.
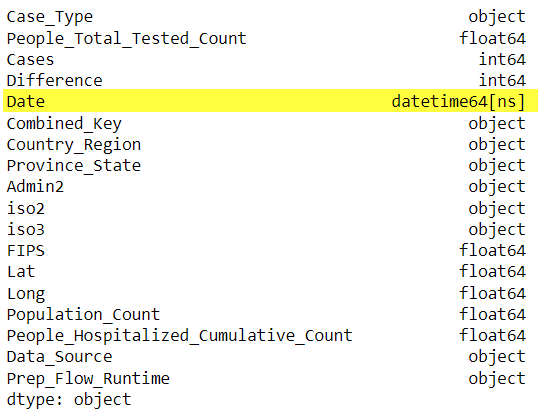
covid['Date'] = covid['Date'].astype('datetime64')
covid.dtypes
Collect only the confirmed data and only the particular required columns.
confirmed_1 = covid.loc[covid['Case_Type'] == 'Confirmed',covid.columns.isin(['Date','Case_Type','Cases','iso2','Country_Region'])]
confirmed_1.head()
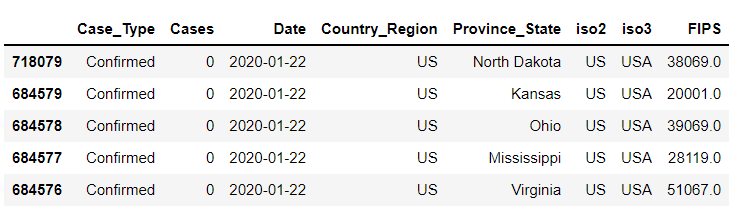
States level visualization:
confirmed_states = covid.loc[covid['Case_Type'] == 'Confirmed',covid.columns.isin(['Date','Case_Type','Cases','iso2','iso3','Country_Region','Province_State','FIPS'])]
confirmed_states.head()
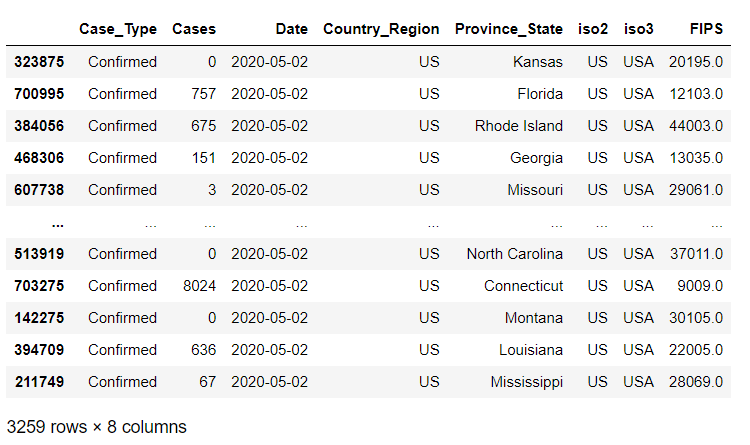
#Overwriting the data with only details of countries we need.
perCountry = confirmed_states.loc[(confirmed_states['Country_Region']=='US') & (confirmed_states['Date'] == '2020-05-02'),:]
perCountry
In our data there is a code
import plotly.express as px
from urllib.request import urlopen
import json
with urlopen('https://raw.githubusercontent.com/plotly/datasets/master/geojson-counties-fips.json') as response:
counties = json.load(response)
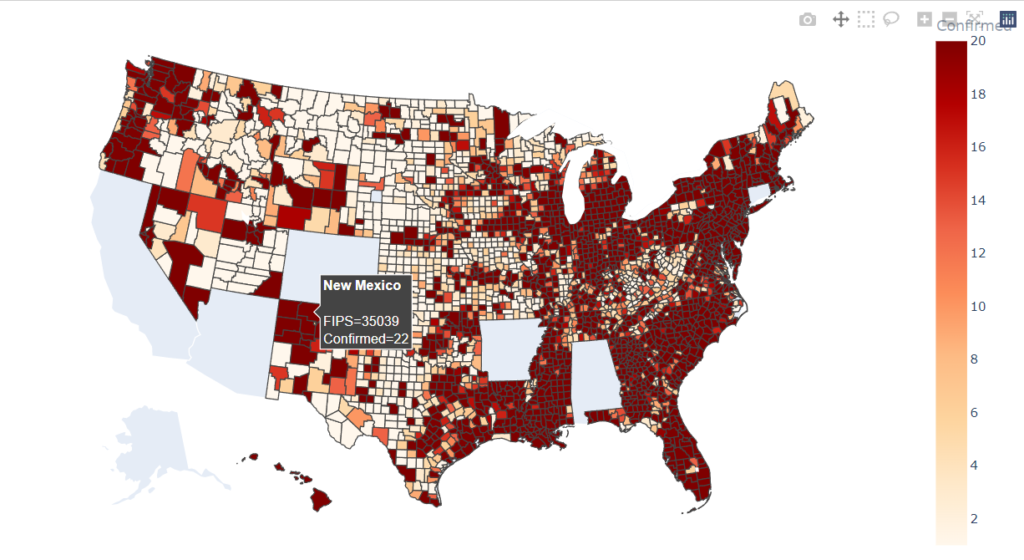
fig = px.choropleth(perCountry, geojson=counties, locations='FIPS',
color='Cases',
color_continuous_scale=px.colors.sequential.OrRd,
color_continuous_midpoint=2,
range_color=(1, 20),
scope="usa",
labels={'Cases':'Confirmed'},
hover_name = 'Province_State'
)
fig.update_layout(margin={"r":0,"t":0,"l":0,"b":0})
fig.show()
Scope
- Determines which area of the map should be the output
- Accepts String value – str
- The ‘scope’ argument can be specified as one of the following values: [‘world’, ‘usa’, ‘europe’, ‘asia’, ‘africa’, ‘north america’, ‘south america’]
locationmode
- This argument determines the location of the data
- Accepts String value – str
- One of the code ‘ISO-3’, ‘USA-states’, or ‘country names’
location
- Takes in a column name of a data frame or list of values to map the State code
color
- A column name of a data frame or list of values
- Determines the color scale for filling the state code
Choropleth Map using State Code:
If the data contains the state code, then locations argument can be mapped using the state codes for USA.
In our old data, the FIPS IDs are only available and the state codes are not present.
We will use different data from Kaggle for this example.
Data Source:
From Kaggle: https://www.kaggle.com/sudalairajkumar/covid19-in-usa/download
File Name: us_states_covid19_daily.csv
df = pd.read_csv('us_states_covid19_daily.csv')

perDay = df.loc[df['date'] == 20201206]
perDay.head()
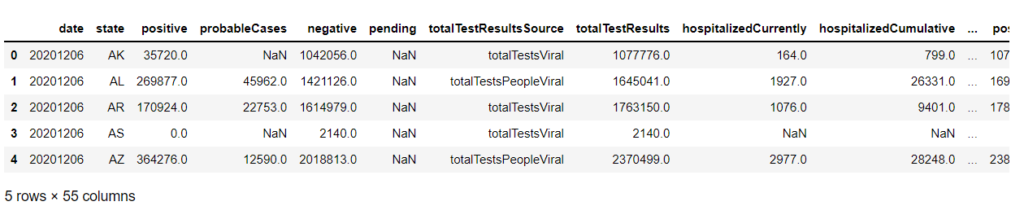
fig = px.choropleth(perDay, geojson=counties,
                    locations=perDay['state'],
                    locationmode="USA-states",
                    color='positive',
                    range_color=(10000, 100000),
                    scope="usa"
                    )
fig.update_layout(margin={"r":0,"t":0,"l":0,"b":0})
fig.show()
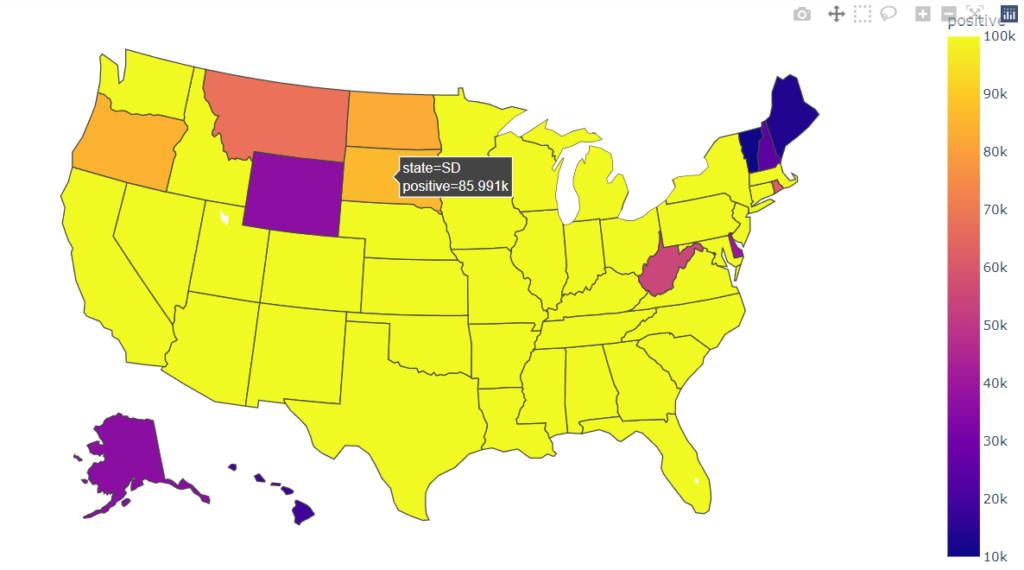
perDay[‘state’] is a column of state codes.
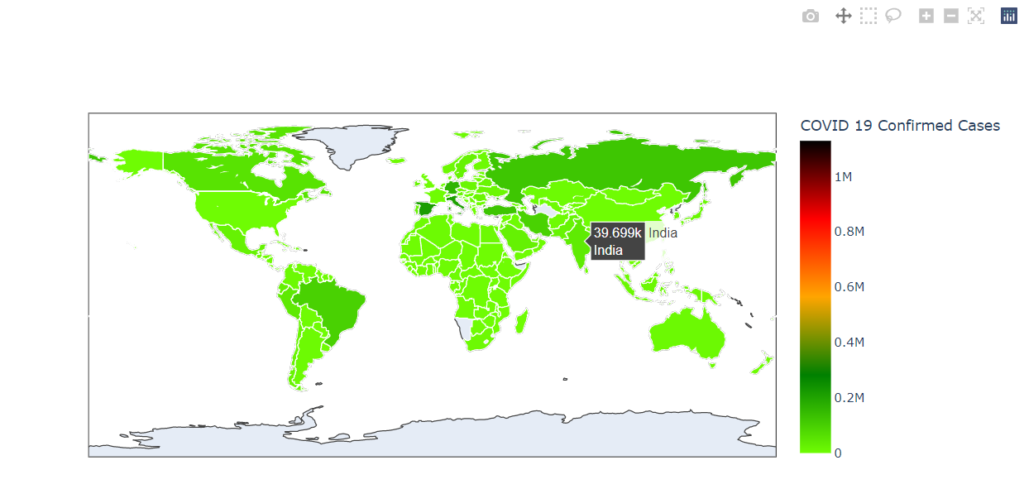
Choropleth Map using plotly.graph_objects
Similar to plotly.express Choropleth maps can be formed using the plotly.graph_objects module.
Lets take the covid data from first example.
import plotly.graph_objs as graph

text = new_pop['Country_Region']
data = dict(type = 'choropleth',
            locations = new_pop['Country_Region'],
            locationmode = 'country names',
            autocolorscale = False,
            colorscale = [[0, 'rgb(111, 252, 3)'],[0.25, 'green'], [0.5, 'orange'],[0.75, 'red'], [1.0, 'black']],
            text= text,
            z=new_pop['Confirmed_Cases'],
            marker = dict(line = dict(color = 'rgb(255,255,255)',width = 1)),
            colorbar = {'title':'COVID 19 Confirmed Cases','len':1,'lenmode':'fraction'})
#Initializing the layout variable
layout = dict(geo = dict(scope='world'))

#Initializing the object for graph_objs.Figure class
asiamap = dict(data = [data],layout = layout)
# Can also use graph_obj
asiamap = graph.Figure(data=data, layout=layout)

#plotting the map
iplot(asiamap,filename='d3-world-map',image_width=800,image_height=600,auto_play=True,animation_opts=None)
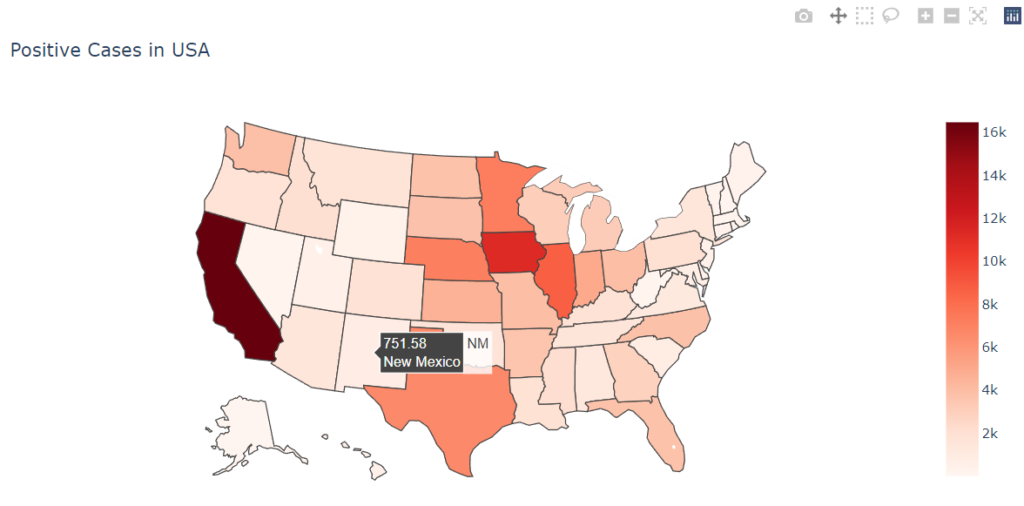
Another example using Kaggle data – USA States:
Directly set the
import plotly.graph_objects as graph

import pandas as pd
df = pd.read_csv('https://raw.githubusercontent.com/plotly/datasets/master/2011_us_ag_exports.csv')

fig = graph.Figure(data=graph.Choropleth(
    locations=df['code'], # Spatial coordinates
    z = df['total exports'].astype(float), # Data to be color-coded
    locationmode = 'USA-states', # set of locations match entries in `locations`
    colorscale = 'Reds',
    text = df['state']
    #colorbar_title = "Millions USD",
))

fig.update_layout(
    title_text = 'Positive Cases in USA',
    geo_scope='usa',
)

fig.show()