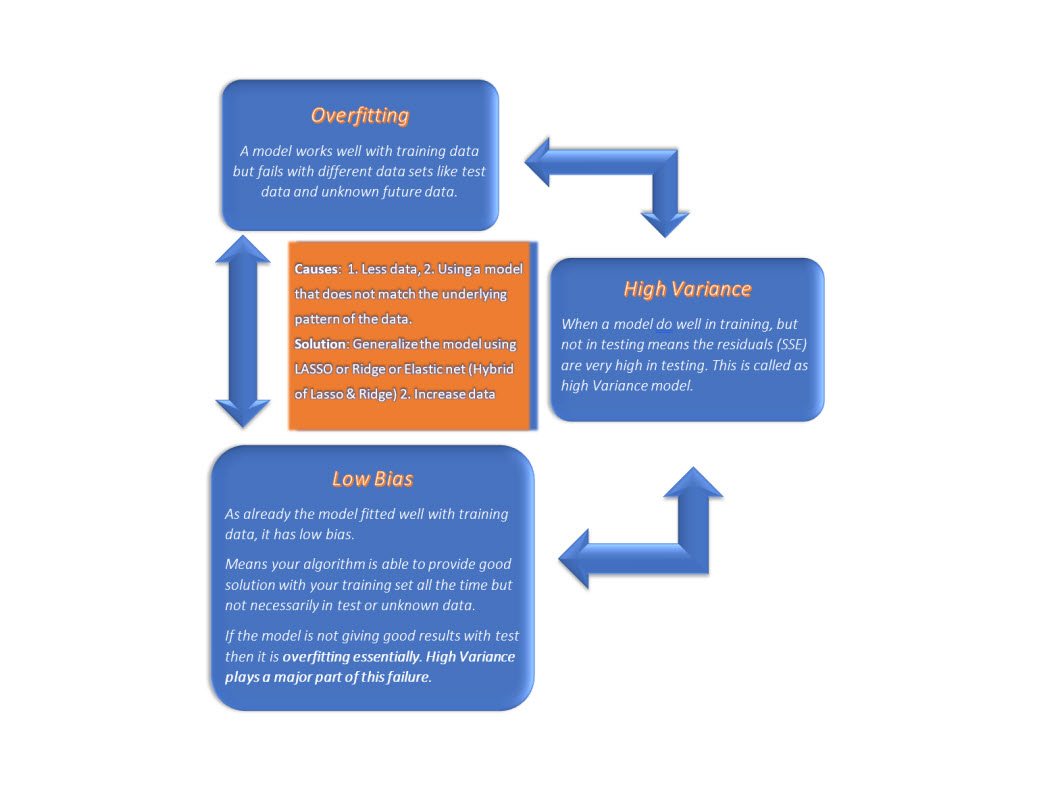
When a Linear Regression model works well with training data but not with test data or unknown any new data, then it means the model is overfitted.

Overfitting occurs when we add more complexity to our model for the training data. When the complexity increases the model reacts to the noise in data.
Here noise means data points that is not really having true relationship with but is just a random choice.
For example, in Polynomial Regression, we increase the degrees too much to fit for the training data but that will fail to behave wisely with test data. This scenario is mentioned with a fancy word OVERFITTING.
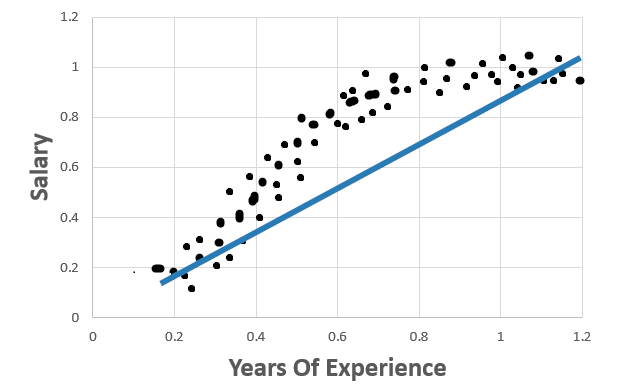
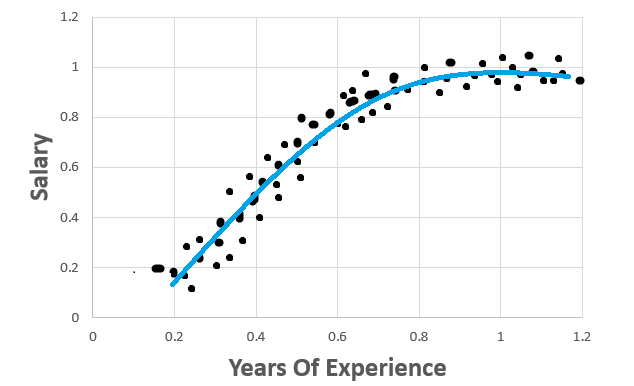
To understand overfitting, let’s take an example of below Linear Regression model.
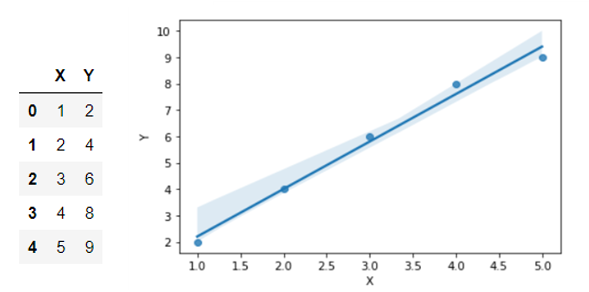
We can see that this regression line fits well for the above data.
Lets see what happens when we plot both the test and train data so that we can compare both of its best fit lines.
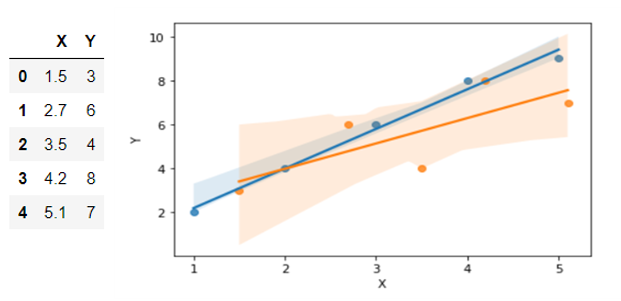
Now you can see that the test data (Orange dots) has a different best fit line than train data.
That means, the sum of error values vary highly for different data sets for the best fit line of training data.
Vary Highly? Yes! That’s called High Variance.
Difference in sum of errors between datasets (training & test) is called variance.
If a model produces less error (SSE) in training and the testing error (SSE) is very high, then it is called high Variance model.
If that model produces error with test data which is very close to the error received in training then it is called Low Variance Model.
In the first ‘Overfitting’ graph, what if we have adjusted our regression line of the training data a little so that it can be generalized for test data as well as different data sets.
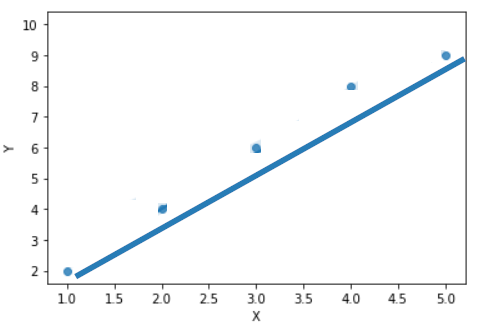
These adjustments can be done by adding a penalty to the SSE values to reduce the coefficients.
When the penalty is too low, say 0, then it is our original Linear Regression which we found as overfitted model.
given that the SSE value is still maintained low, by gradually increasing the penalty, the coefficients start decreasing gradually, the best fit line moves little by little so that the model will be generalized.
In a point, by increasing the penalty, the line moves out of the generalized point and becomes not a best fit line anymore.
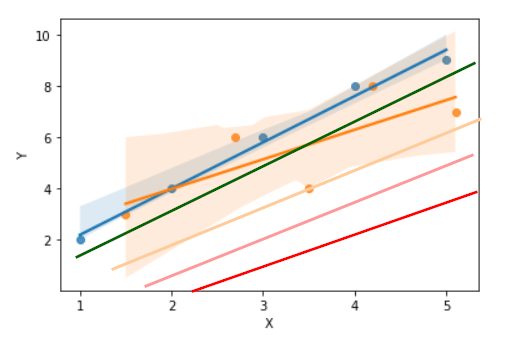
In the above graph, we have plotted, generalized lines with different penalties.
When the penalty in increased a little, we get the green line so that it can generalize the model. (just for the demonstration, I have plotted it by hand)
When increasing further, the line moves out of data. The yellow, pink and then Red line is not even near to the data, which is not a good sign. Thus, when increasing the penalty, fitness of the model starts to go underfitting (not a fit for any set of data).
This way of adding penalty to a linear regression cost function is called regularization.
Shrinkage/Regularization methods:
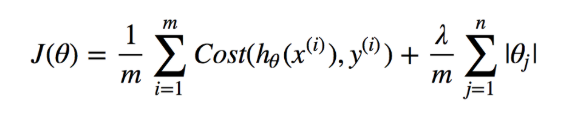
- Lasso — L1 Regularization
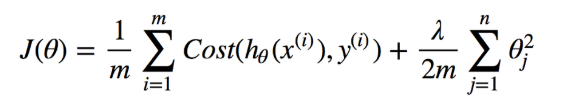
- Ridge — L2 Regularization — To know how flexible our model is. The higher the regularization the less prone our model will be to over-fit.
LASSO or L1 Regularization:
Ridge or L2 Regularization:
Now we have seen Overfitting and how High Variance plays in that.
Lets see how Bias is related to Variance.
In the below graph, there are only 3 data points.
What is Bias?
Consider the below Linear Regression model:
In this graph, the data points fit well for a Polynomial Regression. But not a Linear Regression. Thus this model produces high error with both training and test data sets. This scenario is called High Bias.
The inability of a machine learning model to find the true relationship is called Bias.
Foreman’s article summarized this:
“Bias is the algorithm’s tendency to consistently learn the wrong thing by not taking into account all the information in the data (underfitting).”
Linear regression can fit the training data very well and the testing data very poorly. This is known as overfitting the data (low bias and high variance).
A model could fit the training and testing data very poorly (high bias and low variance). This is known as underfitting the data.
An ideal model is to fit both training and testing data sets equally well.
High bias happens when:
1. We have very less amount of data by which we cannot find the true relationship in data.
2. When using a model that does not match the underlying pattern of the data. Example: When we try to build a linear model for a non linear data.
To overcome Overfitting:
- Use regularization (i.e. Lasso, Ridge, Elastic Net).
- Remove features that do not really have a relationship.
- Add more data points.
To overcome Underfitting:
- Underfitting means your model is too simple .Add more complexity to your model such as using polynomials of your features. (i.e. Increasing the degrees of polynomial regression.)
- Incorporating more features or calculate interactions of the features.
Conclusion:
- Linear regression can fit the training data very well and the testing data very poorly. This is known as overfitting the data (low bias and high variance).
- Similarly, it could fit the training and testing data very poorly (high bias and low variance). This is known as underfitting the data.
- An ideal model is to fit both training and testing data sets equally well.
- Still we can overcome from these problems by using regularization or adding mode features or by adding more data points.
Thank you! 👍
Like to support? Just click the heart icon ❤️.
Happy Programming!🎈