In this article we will be researching on the Titanic Dataset with Logistic Regression and Classification Metrics.
Lets see how to do logistic regression with Python — LogisticRegression() from sklearn.
I have taken the Titanic data set from Kaggle. https://www.kaggle.com/c/titanic/data
raw = pd.read_csv('train.csv')
df = raw.copy()
raw_test = pd.read_csv('test.csv')
test = raw_test.copy()
df.head()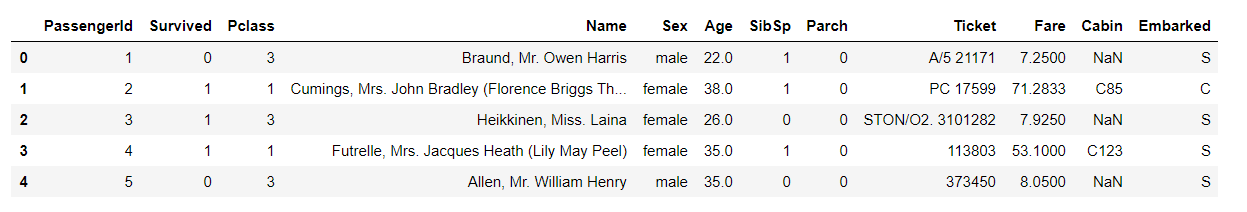
Here I have skipped the data processing section except encoding. I will come up with a new post specially for Data Pre-Processing.
Here I have skipped the data processing section except encoding. I will come up with a new post specially for Data Pre-Processing.
- Removed Cabin as it seem to be Large number of Null columns and not much info can be received with a column which has high manipulated values.
- Encode the Category columns. I am going to do all the encoding for the validation dataset (test.csv) also.
- Drop original columns and concat the encoded columns.
#1=>
df = df.drop(['Cabin', 'PassengerId', 'Name', 'Ticket', 'Cabin'], axis = 1)
test = test.drop(['Cabin', 'PassengerId', 'Name', 'Ticket', 'Cabin'], axis = 1)

#2=>
df['SibSp']=df['SibSp'].astype('category')
df['Parch']=df['Parch'].astype('category')
test['SibSp']=test['SibSp'].astype('category')
test['Parch']=test['Parch'].astype('category')
encodedDF = pd.get_dummies(df[['Embarked','Sex','SibSp','Parch']])
testencoded = pd.get_dummies(test[['Embarked','Sex','SibSp','Parch']])

#3=>
df = df.drop(['Survived','Embarked','Sex','SibSp','Parch'],axis=1)
test = test.drop(['Embarked','Sex','SibSp','Parch'],axis=1)
X = pd.concat([encodedDF,df],axis=1)
Val = pd.concat([testencoded,test],axis=1)

y= raw['Survived']

X_train.head()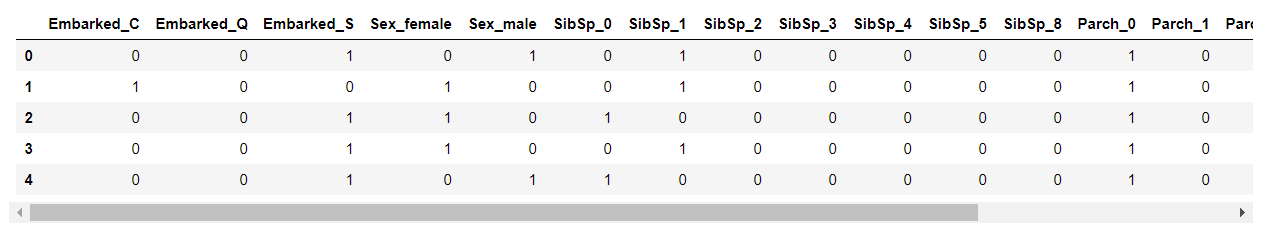
Model — Using LogisticRegression:
from sklearn.model_selection import train_test_split
from sklearn.linear_model import LogisticRegression
X_train, X_test, y_train, y_test = train_test_split(
     X, y, test_size=0.2, random_state=101)
log = LogisticRegression()
log.fit(X_train,y_train)
print("Intercept: " , log.intercept_)
print("Coefficients: " , log.coef_)
predict = log.predict(X_test)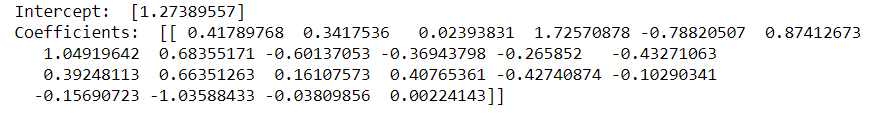
Finally we predicted Survived values for test data using predict() method.
Metrics
Packages to import for Error Metrics:
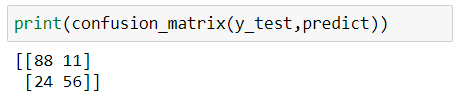
from sklearn.metrics import accuracy_score, classification_report, confusion_matrix,roc_auc_score1. Confusion Matrix
It is a clear representation of Correct Predictions. All the Correct Predictions fall in the diagonal order.
2. Classification Accuracy
This metric measures the ratio of correct predictions over the total number of predictions. For Higher accuracy, the model gives best.
print(accuracy_score(y_test,predict))Output: 0.8044692737430168
3. ROC Curve & AUC Score
ROC (Receiver Operating Characteristic) curve is a visualization of false positive rate (x-axis) and the true positive rate (y-axis).
predict_proba(…) provides the probability in arrays. pred_prob[:, 1] means we are taking only the positive values.
pred_prob = log.predict_proba(X_test)
probs = pred_prob[:, 1]

auc = roc_auc_score(y_test, probs)
print('AUC Score: %.2f' % auc)


fpr, tpr, thresholds = roc_curve(y_test, probs)
plt.plot(fpr, tpr, color='orange', label='ROC')
plt.plot([0, 1], [0, 1], color='darkblue', linestyle='--')
plt.xlabel('False Positive Rate')
plt.ylabel('True Positive Rate')
plt.title('Receiver Operating Characteristic (ROC) Curve')
plt.legend()
plt.show()
AUC Score: 0.88
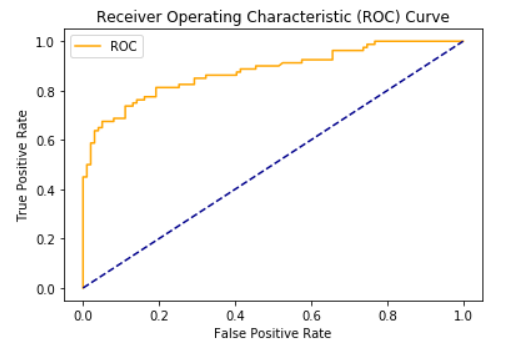
We can see that ROC curve is not bad. With more pre-processing, we can increase the AUC score. To know more about ROC curve, please visit Logistic Regression Part II — Cost Function & Error Metrics.
4. Classification Report
This is a summary of metrics for each class.
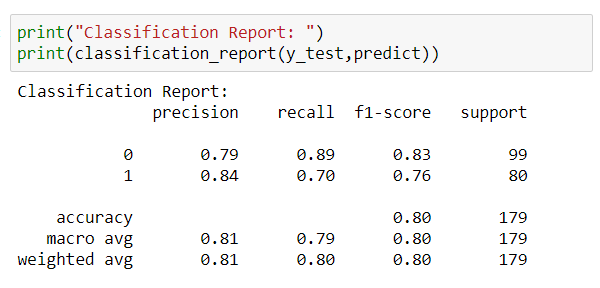
In the above report, we have Precision, Recall, F1-Score for both 0 & 1 classes separately.
Conclusion:
In this article we have seen how to predict Discrete values using Logistic Regression.
To know more about Logistic Regression:
- Logistic Regression Part I — Transformation of Linear to Logistic
- Logistic Regression Part II— Cost Function & Error Metrics
Please try Logistic Regression and drop your comments here.
Thank you! 👍
Like to support? Just click the heart icon ❤️.
Happy Programming!🎈