In this article we will learn about Regression.
I am not going to give you 2 lines of definitions for Regression and Classification.
Before going into the definition, let us look into a real-world problem and discuss on what we can do to solve those problems. If you still prefer to know the Definition/Summary first then please skip to the Conclusion section.
Let us consider we have a data of 150 employee’s years of experience and their salaries.
We need to write a model which can help us to predict the salary of an employee based on his years of experience by learning from the data that we have in hand (150 employee’s data).
Let’s forget about the model and programming and look at the data.
We have 2 variables — Years of experience and Salary.
One good way to visualize the data is a graph right! Let’s do it.
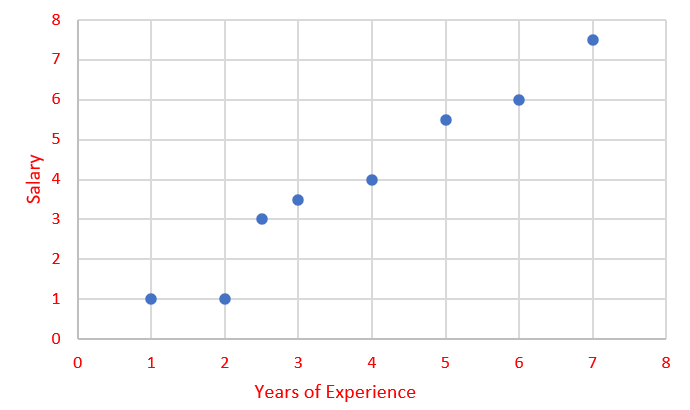
Okay! Now we have plotted it.
Here we can observe that there is a trend in data. When Years of Experience increase, the Salary also increased.
By using this trend, we can draw a trend-line in the graph as below.
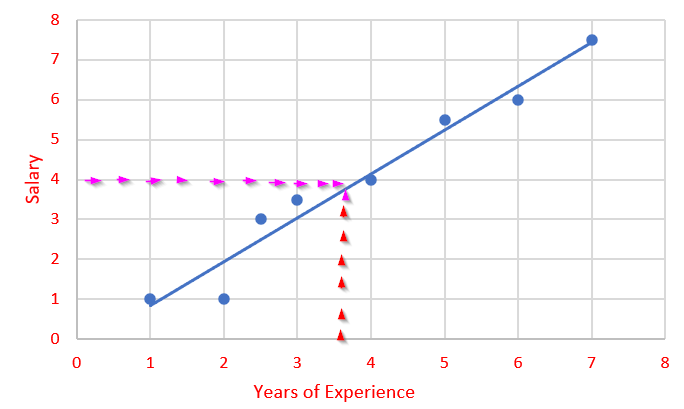
Now we know the trend of the data and we can somewhat mind map and predict what will be the salary for a particular experience.
Consider that now you want to predict the salary of a new employee, whose experience is 3.5.
Note that I have drawn a red dotted and pink dotted lines in the above graph which mentions that you can predict the salary for 3.5 years using the trend line. 4!
This way of prediction falls under Regression.
Regression is a problem of predict the output values based on input values by using the historical data.
How the prediction happened?
We had some advantages in the given data. What were they?
Advantage Number 1: There was a trend between Experience and Salary. So, we made a trend line and predicted the Salary. Even though all the points are not in trend line, we can be sure for some good confidence level.
This way of predicting output based on a straight-line of trend is called Linear Regression.
Linear Regression is a linear approach to model the relationship between a two or more variables by fitting a straight line i.e. linear, to predict the output for the given input data.
As the trend is a Straight line, we will use the equation of the straight line to find the Output (y) value.
Straight Line Equation: y = mx + c
What if there is a different trend?
Consider the below graph.
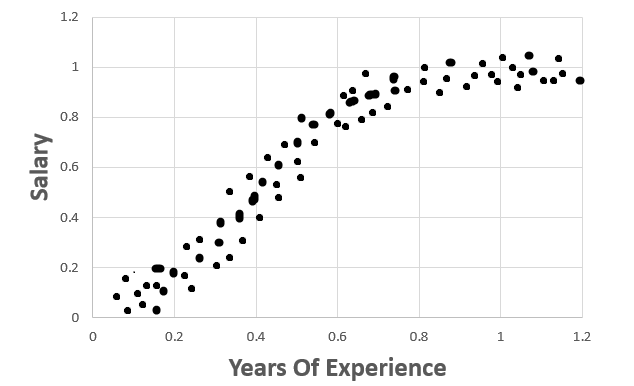
In this data the trend is different and it seems, a curve fits very well than a line. But still there is a trend.
This Regression falls under Non-Linear Regression.
For different types of Non-Linear curves, the equations change.
I am not giving the equations here as I do not want to scare people who are new to regression algorithms.
If interested to read more about Non-Linear Regression algorithms, please visit this page by Jim Frost.
Non-Linear Regression is a regression analysis in which the model is fitted by a function which is a nonlinear combination of the model parameters.
Advantage Number 2: Correlation with Causation
What if there is no trend?
When there is no trend then that means there is no relationship between the two variables. So, we cannot predict the output based on input variables.
This relationship can be determined by the Correlation Coefficient between two variables X & Y.
For highest correlation coefficient, the output is more accurate.
Okay! What if we get a data which says good correlation coefficient between two variables but that cannot be true in real world?
This is the place where we may be fooled by numbers.
Once my friend explained this very well with an example. Consider the problem that we need to predict the house price based on the age of the house owner. Also, unfortunately, the data says positive good correlation of 0.9.
But we know that this cannot be true. In this case, if we make a model with these 2 variables, the result will be a failure.
We all know about the housing prices and it mostly determined by the size of the house, locality, facilities and age of the house etc. But why should people care about the age of the house owner?
Size of the house, locality, facilities available in the property will make some percentage of cause in the pricing.
We can apply Regression analysis only when there is a Correlation and Causation exist.
Advantage Number 3: Data was continuous.
In our example, Salary is a continues data.
Consider the we have a data of Tumor detected patients and the result of the examination is malignancy or not.
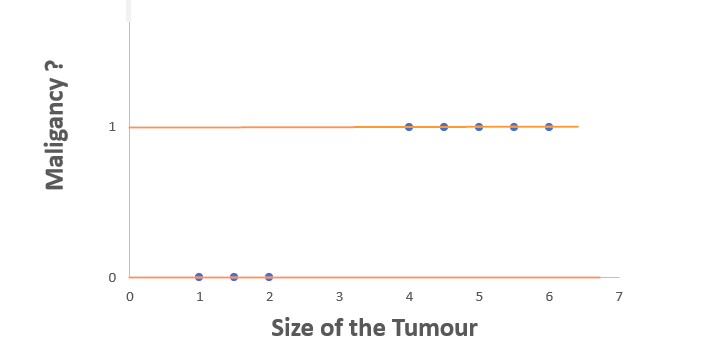
In this data, if we plot it in a scatter plot it will become like the above. Because if you see the dependent variable (or Y axis values), it is not continuous. It is Discrete — values are either ‘Yes’ or ‘No’.
With this data we cannot have a graph with a line or a curve. This type of analysis falls under classification as we just classify our output into one of two categories.
Classification is a problem of predicting output values which is Discrete (Categorical).
Regression is a problem of predicting output values which is Continuous (Numerical/Quantitative).
Now its time to summarize what we discussed here.
Conclusion:
Regression is a process of predicting the output values based on input values by using the historical data.
To perform Regression:
- The data should be continuous.
- The Input and Output variables should have Correlation as well as Causation.
Classification is a process of predicting output values which is Discrete (Categorical).
P.S. If you are curious on how the name REGRESSION came into use, check this page. It is really interesting to know a little history of what we are doing. Isn’t it?
Thanks to:
https://statisticsbyjim.com/regression/difference-between-linear-nonlinear-regression-models/
Difference Between Classification and Regression in Machine Learning