We know that we can replace the nan values with mean or median using fillna(). What if the NAN data is correlated to another categorical column? What if the expected NAN value is a categorical value? In this article we will learn why we need to Impute NAN within Groups.
Below are some useful tips to handle NAN values.
Definitely you are doing it with Pandas and Numpy.
import pandas as pd
import numpy as np
Lets take the agriculture data and impute NaN values.
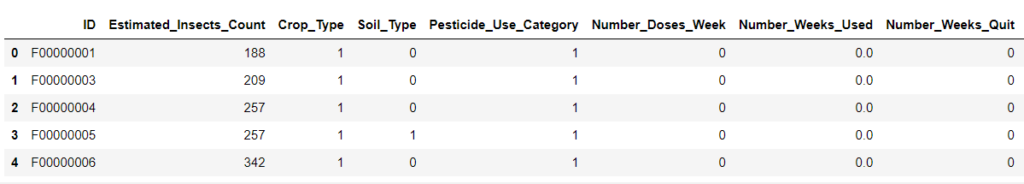
Now we have NaN values in Number_weeks_used column. This column indicates how many weeks the Particular pesticide category is used.
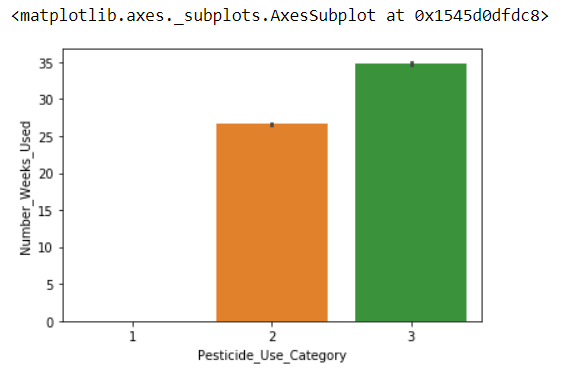
So, the column Number_Weeks_Used & Number_Doses_Week depends on the Pesticide_Use_Category column.
df_train.groupby('Pesticide_Use_Category').count()['Number_Weeks_Used']
Pesticide_Use_Category
1      740
2    57230
3    21888
Name: Number_Weeks_Used, dtype: int64
sns.barplot(x='Pesticide_Use_Category', y='Number_Weeks_Used' ,data = df_train[['Pesticide_Use_Category','Number_Weeks_Used']])
The imputation within a group of other column can be done in many ways. We will try most of the ways.
Impute using GroupBy and Transform:
Impute Number_Weeks_Used within the group of Pesticide_Use_Category:
Impute regression column within a group using mean() function.
Impute categorical column within a group using the mode() function.
Impute Regression Column:
df_train['Number_Weeks_Used'] = df_train['Number_Weeks_Used'].fillna(df_train.groupby('Pesticide_Use_Category')['Number_Weeks_Used'].transform('mean'))
Impute Categorical Column:
If a Categorical column needs imputation and it depends on another column, then we can use Mode() function.
df_train['Category_Column'] = df_train['Category_Column'].fillna(df_train.groupby('Dependent_Column')['Number_Weeks_Used'].transform('mode'))
Lets see other ways to impute within groups.
Impute using ngroup:
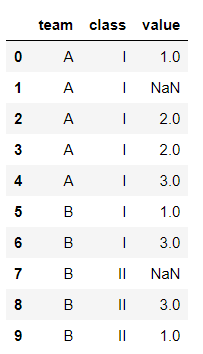
cl = pd.DataFrame({
'team':['A','A','A','A','A','B','B','B','B','B'],                   'class'['I','I','I','I','I','I','I','II','II','II'],
'value': [1, np.nan, 2, 2, 3, 1, 3, np.nan, 3,1]})
Lets assume if you have to fillna for the data of liquor consumption rate, you can just fillna if no other data is relevant to it.
But if the age of the person is given then you can see a pattern in the age and consumption rate variables. Because the liquor consumption will not be in same level for all the people.
An another example is fillna in salary value could be related with age, job title and/or education.
In this case we can Impute NAN values within Groups which gives more better results than overall imputation.
In the above example, let assume that columns test and class are related to value.
Using ngroup you can name the group with the index.
cl['idx'] = cl.groupby(['team','class']).ngroup()
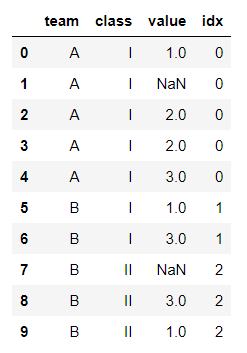
Now you can clearly understand the goups now and we named the groups with index. It will be helpful in situations where you wanted to handle data in such complex groups. for example fillna with a complex group of 10 columns.
Impute using GroupBy – Apply – Lambda:
Group by 2 colums and fillna with mean
Lets take the below data:
cl = pd.DataFrame({
'team': 'A','A','A','A','A','B','B','B','B','B'],
'class':['I','I','I','II','II','I','I','II','II','II'],
'value': [1, np.nan, 2, 2, 3, 1, 3, np.nan, 3,1]})
As discussed earlier now we want to fill nan with mean by group of team and class.
cl['value'] = cl.groupby(['team','class'], sort=False)['value'].apply(lambda x: x.fillna(x.mean()))
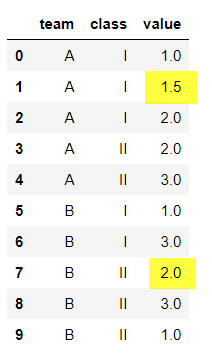
With team A and class I, the mean value of 1.0 and 2.0 is 1.5. Similarly the remaining groups. you can see that both the null values are imputed with different means (yellow shaded values). i.e. the mean of each group.
Group by 2 colums and fillna with mode
Mode is not compatible with fillna as same as mean & median.
Mean & median returns and works as same ways, both returns a series. But mode returns a dataframe.
To use mode with fillna we need make a little change. We need to locate the fist data using iloc.
df = pd.DataFrame({'A': [1, 2, 1, 2, 1, 2, 3]})

a = df.mode()
print(a.iloc[0])
print(type(a))
A 1
Name: 0, dtype: int64
<class ‘pandas.core.frame.DataFrame’>
df = pd.DataFrame({'A': [1, 2, 1, 2, 1, 2, 3]})

a = df.mean()
print(a)
print(type(a))
A 1.714286
dtype: float64
<class ‘pandas.core.series.Series’>
Now Lets impute the NAN values with mode for the below mentioned data.
cl['value'] = cl.groupby(['team','class'], sort=False)['value'].apply(lambda x: x.fillna(x.mode().iloc[0]))
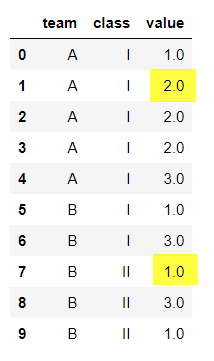
The mode of 1,2,2,3 is 2.
Group by 1 column and fillna
Data:
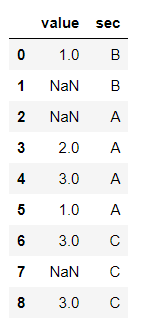
cl1['value'] = cl1.groupby('sec').transform(lambda x: x.fillna(x.mean()))
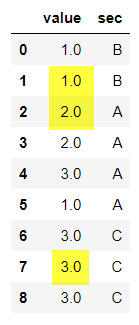
The below statements also work.
cl1['value'] = cl1.groupby('sec')['value'].transform(lambda x: x.fillna(x.mean()))
Result:
Conclusion:
In this article we have learned about better way to group data and fillna.
Hope you are excited to practice what we have learned now.
We will meet with a new tip in Python. Thank you! 👍
Like to support? Just click the heart icon ❤️.
Happy Programming!🎈