In Inferential Statistics, there are ways to test and validate our results from an experiment. These methods are called Hypothesis Testing and it can be categorized into two parts.
Parametric Testing: This type of tests make assumptions about the Population parameters and the distributions that the data came from. These types of test includes Student’s T tests and ANOVA tests, which assume data is from a normal distribution.
Non- parametric Testing: Non-parametric tests are used when there is no or few information available about the population parameters.
Z Test:
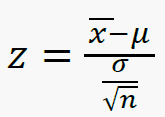
To find test statistics, we can use the below formula.
Z test can be done if the below 3 points are satisfied:
- Sample size should be > 30.
- Population SD should be known.
- Variables should be continues.
Steps for Z Test:
- State Null & Alternate Hypothesis.
- Find the Level of significance (α).
- Find Critical Values.
- Find test statistic.
- Make conclusion.
Example:
1,500 women followed the Atkin’s diet for a month. A random sample of 29 women gained an average of 6.7 pounds. Test the hypothesis that the average weight gain per woman for the month was over 5 pounds. The standard deviation for all women in the group was 7.1.
Given:
Population: 1500
Population SD: 7.1
Sample Size: 29
Sample Mean: 6.7 pounds
To test: Test the hypothesis that the average weight gain per woman for the month was over 5 pounds.
So here the average weight gain of the total population is 5 pounds. So population mean is 5 pounds. We need to test the hypothesis that average weight is above 5 pounds.
Obviously our Null hypothesis is µ > 5 pounds.
If we reject the null hypothesis then it means the sample average weight gained is close to or less than the population average weight gained.
Step #1:
Null Hypothesis: H0: µ > 5
Alternate Hypothesis: As alternate hypothesis is the opposite of Null Hypothesis, Here alternate hypothesis is H1 <= 5.
Step #2: Level of Significance:
As the confidence/significance level is not given then we can consider it as 95% confidence level.
C = 0.95
α = 1 – 0.95 = 0.05
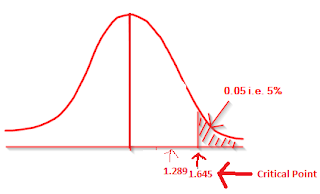
Step #3: Critical Value for 95% confidence level α is 1.645.
Step #4:
The Sample mean – population mean = 6.7 – 5 = 1.7
σ /√n = 7.1/√29 = 7.1/5.38 = 1.3197
z = 1.289 which is < 1.645
Step #5: Conclusion
As the z value is less than critical value, the z value falls in accept region.
So we accept the Null Hypothesis.
T Test or Students T Test:
If the sample size is <30 i.e. n<30 then those samples are considered as small samples.
The methods used for small samples can be used with large samples. But the vice versa is not appropriate.
Per Central Limit Theorem, the distribution will become normal when the sample size increases.
With a small sample the distribution may not be normal, even if it looks normal it is not more like a bell curve as a normal distribution.
When sample size is 30 or less than 30 and the population SD is unknown, then we can use the t-distribution.
Conventions of T Test:
- The population from which the samples are drawn is normal
- Sample is random.
- Population SD is not known.
Applications of t-test:
- Test of hypothesis about population mean.
- Test the hypothesis about the difference between two means.
- Test the hypothesis about coefficient of correlation.
Formula:
To find the interval: ẍ ± t-table value * (s/√n)
To test the hypothesis: (ẍ – 𝛍)/(s/√n)
Example:
A company wants to improve sales. Past sales data indicate that the average sale was $100 per transaction. After training the company’s sales force, recent sales data (taken from a sample of 25 salesmen) indicates an average sale of $130, with a standard deviation of $15. Did the training work? Test your hypothesis at a 5% alpha level.
Step #1:
H0: µ = 100
H1: µ > 100
Step #2:
Level of significance α = 0.05
Step #3:
x̄ = $130
μ = $100
sample standard deviation(s) = $15
Sample Size (n) = 25
Find the t-table value:
Look up 24 degrees of freedom in the left column and 0.05 in the top row. The intersection is 1.711.This is your one-tailed critical t-value.
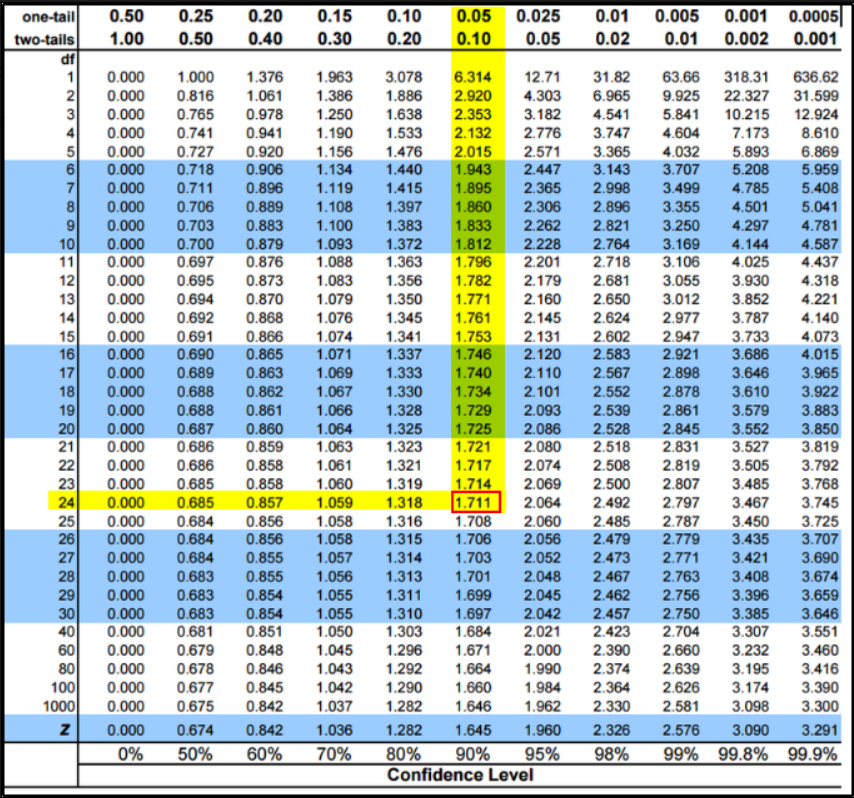
As marked in the above picture, T value is 1.711.
Step #4:
(130 – 100) / (15/RootOf 25) = 30/3 = 10
Step #5:
The calculated value is greater than T value 1.711
Test Conclusion: We fail to accept the null hypothesis.
Conclusion:
In this article we learned about the basics of Hypothesis testing and 2 types of testing: Z-Test & T-Test.
We will see in another interesting article for hypothesis testing.
Thank you! 👍 Happy Learning 🎈.
Like to support? Just click the heart icon ❤️.