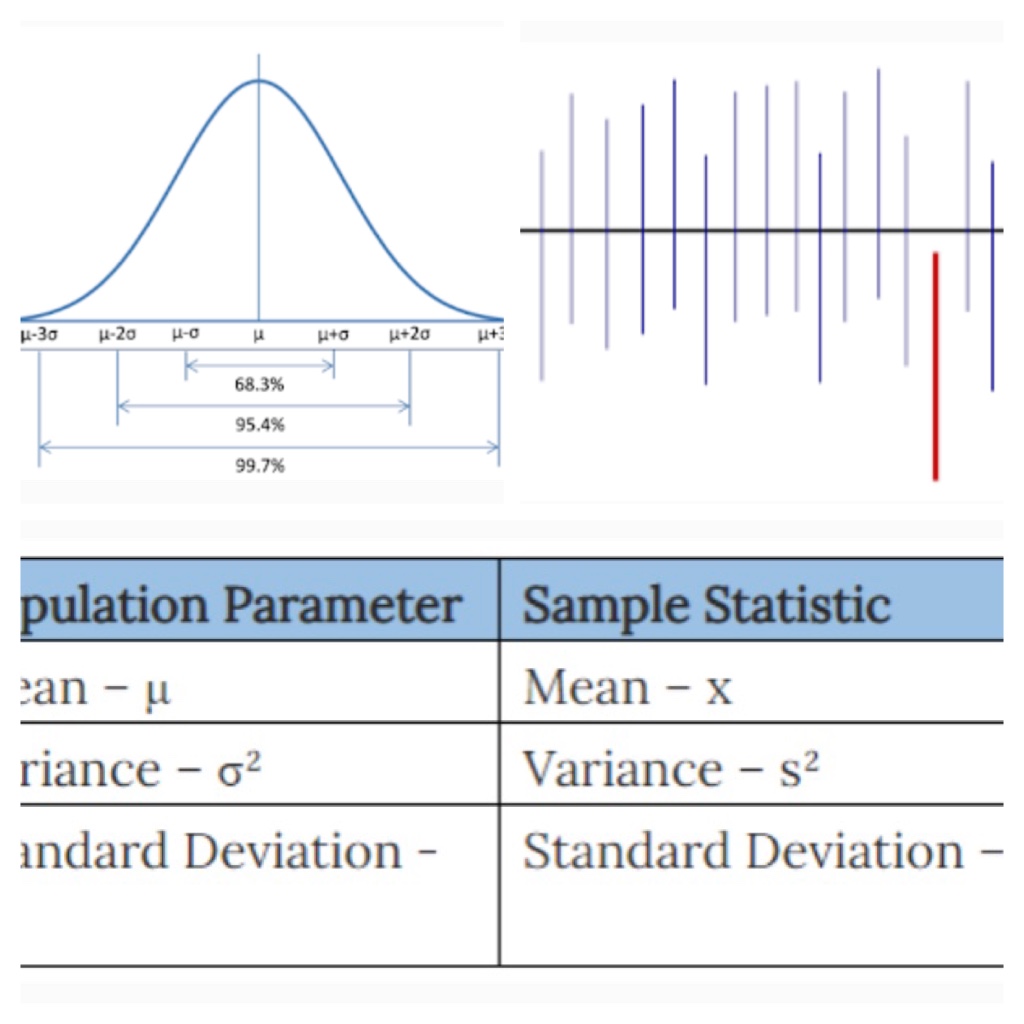
This article gives an introduction to Inferential Statistics. Inferential statistics helps us to predict/inference from the data.
Population: Population is a set of data on which we need to infer.
Sample: Sample is a subset of data which is drawn from Population.
Parameter: The measures we made on population data are called Parameter.
Statistic: The measures we made on Sample data are called Statistic.

Standard Error:
Per CLT, the mean of each sample’s mean will reflect the population mean.
In the sampling distribution, the variance between all the sample means from the mean is referred as Standard Error.
S.E = σ / √n
Confidence Interval & Confidence Level:
To estimate the population parameter (mean), we collect a random sample from the population and compute it to find statistic.
But if we are giving our result as a single value, then we are in risk that the real value may be different even in 1 or 2 numbers always, still that shows that our results are not certain.
What if we provide an interval in which our result lies?!
This interval is called confidence interval.
“Confidence intervals are extremely valuable for any usability professional. A confidence interval is a range that estimates the true population value for a statistic.”—Tom Tullis and Bill Albert
A Confidence Interval is a range of values we are fairly sure our true value lies in.

Here you can notice that 1 red line is not complying with the mean µ.
As all our results are not necessarily to be true, if we give it a percentage, 95% of data falls in the confidence interval.
I.e. 1 in 20 samples may not project the population mean.
Margin of Error:
The margin of error expresses the maximum expected difference between the true population parameter and a sample estimate of that parameter.
Formula to Calculate Margin of Error:
M.E = z * S
Recollect what we know from Normal Distribution:
In a normal distribution, we know that 68% of data lies between -1 & +1 Standard Deviation.
95% of data lies in -2 & +2 Stan. Dev. 99.7% of data lies between -3 & +3 Standard Deviation.

This percentage value 95% is the confidence level we provide to our result.
If we say 68% of confidence level, then our result value should be somewhere between -1σ to +1σ. But still there are some possibility that the true mean may fall outside of this range.
If we say 95% of confidence level then less possibility that our true mean falls outside, because 95% of data will fall within the range of -2σ to 2σ.
I.e. Our result are more certain than 68% of confidence level.
As we increase the confidence level, the more certain our results are.
Even we can say 99% but we cannot say 100% as there is some probability of our results may become false.
So if we say that 95% is a confidence level, then what we call the other 5%?
It is the range where our results are not true i.e. Fail.
That means, our results are significant.
We call this percentage as significance level.
As the normal distribution is a continuous probability distribution, the entire area under the curve becomes 1.
So the area in confidence level is called “C” – confidence value.
If the confidence level is 95%, then the confidence value becomes 0.95 (95/100).
So. C = 0.95
Obviously, the significant level (We denote it as α) becomes 1 – 0.95 = 0.05.
α = 0.05
Learn More about Inferential Statistics & Hypothesis Testing:
Conclusion:
We will see in another interesting article on more about inferential statistics.
Thank you! 👍 Happy Learning 🎈.
Like to support? Just click the heart icon ❤️.

